Viewing the Dashboard
The Dashboard offers a personalized view of your EPASS Reports usage, displaying information specific to the logged-in user.
Your Dashboard is divided into four sections. The different sections give you an "at-a-glance" view by showing your frequently used reports, upcoming scheduled reports, reports that you need to download in My Reports, and your report usage statistics.
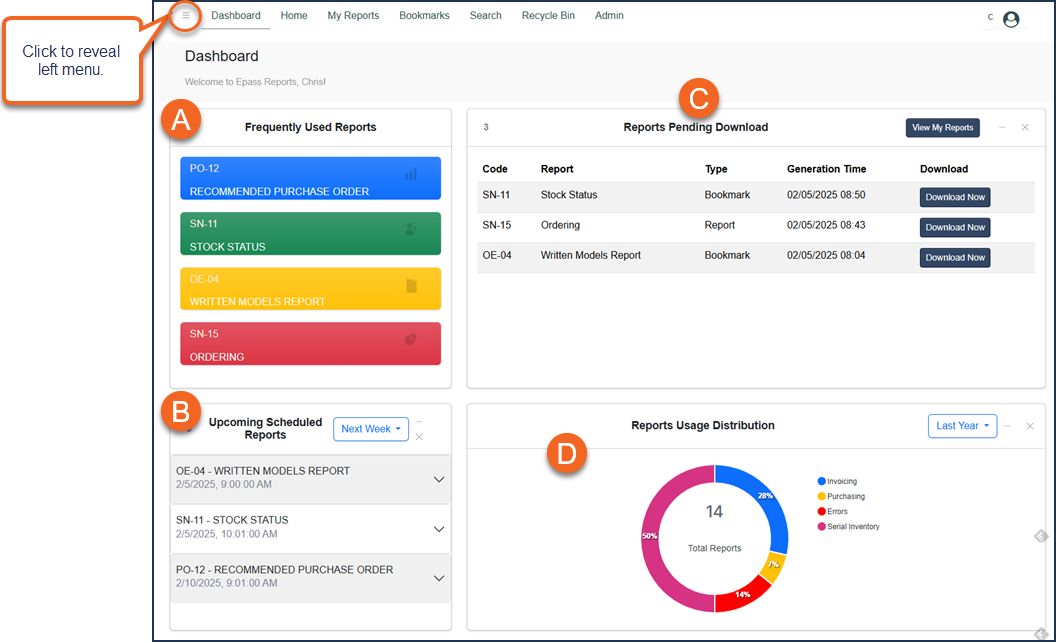
Frequently Used Reports
Reports that you use often are listed in this area.
- Click on a report in this area to jump directly to its parameters screen.
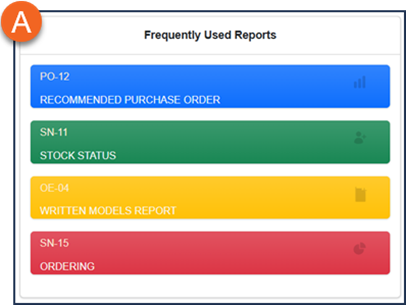
Upcoming Scheduled Reports
Reports that are scheduled to run in the future are listed in this area.
- Change the view with the dropdown and select reports that are scheduled for today, tomorrow, next week, or next month.

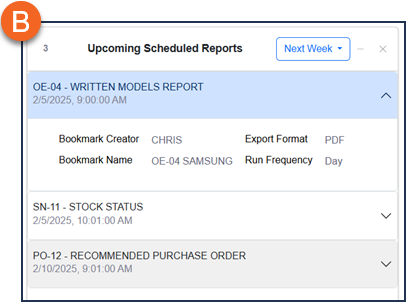
- Click a report in the list to expand it and view its details.
Reports Pending Download
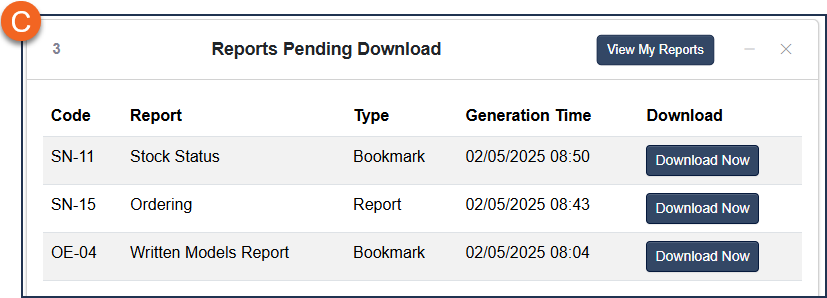
Reports that are currently in My Reports and are waiting for you to download are listed in this area.
- Click the Download Now button to download the report instantly, without having to go to the My Reports screen.
Reports Usage Distribution
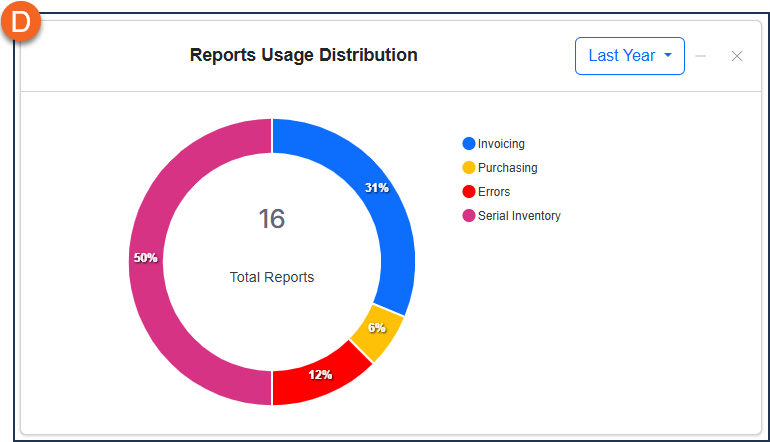
EPASS Reports tracks the report types you've run and displays them as percentages in this chart.
- Change the view of your report usage from the dropdown menu. You can view reports run today, last week, last month, the last 3 months, the last 6 months, or last year.
